
Plan: A well-developed plan includes the what, who, when, where, outcome predictions, and the data to be collected. Consider the following questions: What exactly will the team do? Remember to only test one small idea with each PDSA cycle. Who will carry out the plan? When will it take place? This should be in a short
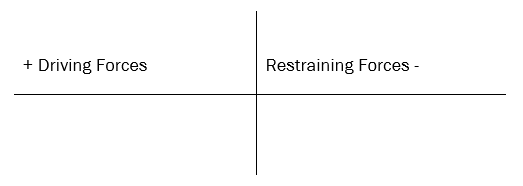
Tool: Force Field Analysis Usage: Identifying factors that can support or hinder a potential solution. Understanding these factors and using strategies to reduce barriers can increase the chances of the solution being successfully implemented. Force Field Analysis is a useful tool to identify the factors that can support or hinder a change or solution prior to
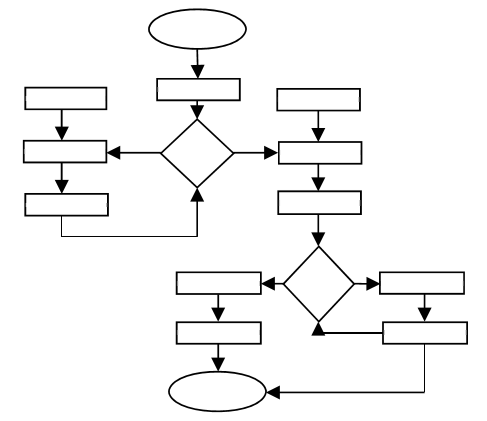
Tool: Process Mapping Usage: Visualising and understanding what happens in a process (for service/process redesign) Process mapping involves developing a simple visual picture or map of a process. It is a relatively simple tool that can help the team understand how the various parts of a process fit together, and improve its overall functioning. When to
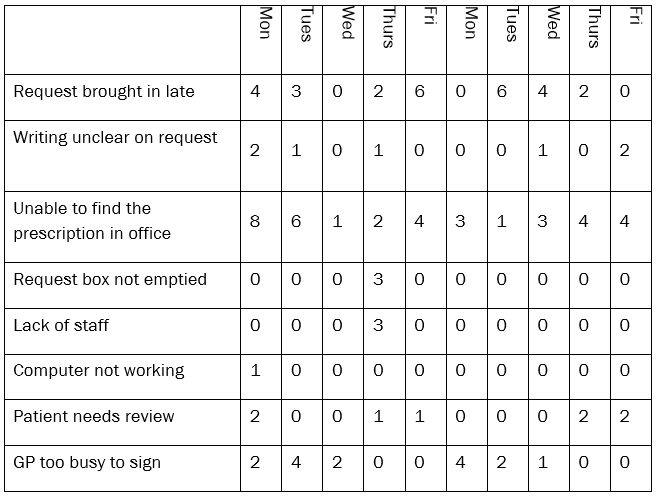
Tool: Pareto Usage: Identifying the causes that have the greatest impact on a problem, which assists with determining where to focus an improvement effort Pareto analysis is a simple technique that uses a bar graph to diagrammatically show the causes that have the greatest impact on a problem. This process helps to focus improvement efforts on the
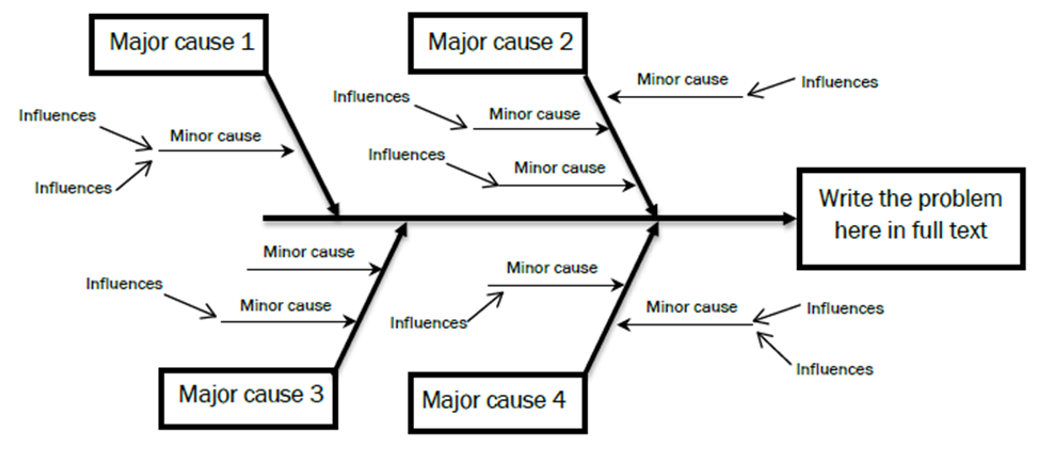
Tool: Fishbone (Ishikawa) Diagram (Cause & Effect) Usage: Exploring and determining factors that cause or influence a problem (cause and effect) The Fishbone Diagram is a visual tool used to explore the factors that influence or cause a problem, in order to help understand the problem more clearly. The tool gets its name from its inventor, Kauro

Tool: 5 Whys Usage: Defining a problem (determining the root cause) The Five Whys helps to identify the root cause of a problem and is a simple, yet powerful tool. The technique originated within Toyota while developing their manufacturing methodologies, and is a key component of their problem solving training. Asking the question ‘why?’ repeatedly (five
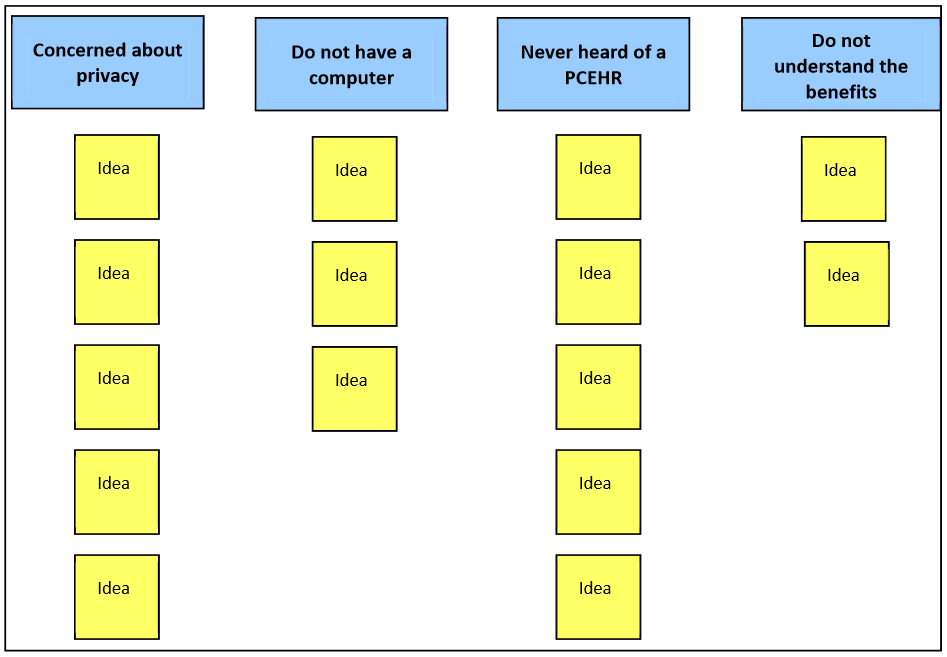
Tool: Affinity Diagram Usage: Organising and categorising ideas An Affinity Diagram is a method for organising ideas into clear patterns or themes, based on their natural relationships. It encourages people to think creatively and make non-traditional connections between ideas, promoting greater ownership of results by allowing breakthroughs to emerge naturally. An Affinity Diagram can be used at

Tool: Brainstorming Usage: Generating Ideas Brainstorming is an activity used to generate creative ideas and can be done individually or as a group. It is not effective as an analytical or decision making tool. After defining the topic for the brainstorming session, come up with as many spontaneous ideas as possible and write them down.